




Stock Exchange lite

Deskripsi Stock Exchange lite
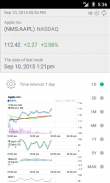
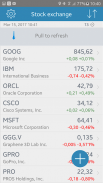
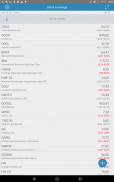
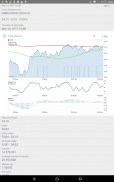
The application will inform you about the stock market. With an easy interface, you will always be informed about the current fall or rise of the shares in market. You can add an unlimited number of companies by their name. You can also view the stock chart for selected company, with an option of choosing the period.
The main features of the application:
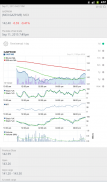
• Graphs of growth and fall by selected companies.
• View daily, weekly, monthly, semi-annual, annual charts, as well as the entire period of stocks sales.
• View all the necessary data on the shares (current price, percentage rise or fall, the volume, the lowest and the highest points, averages, and so on).
• Easy operation and friendly user interface of the application.
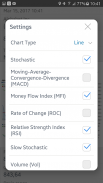
• Various interface settings.
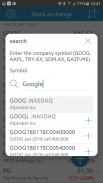
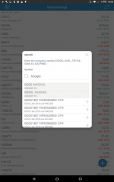
• Adding companies by their symbol on the stock exchange.
• Off-line operation for last downloaded data (no network connection needed).
• Search buttons for easy company search in a stock exchange.
Basic data :
Daily price range, market capitalization, the opening price, trading volume, average volume for 3 months, the last trading date, 50-day moving average price, 200-day moving average price, 52-weeks price range , Ask, Bid, EPS annual expected, EPS expected in the next year, EPS expected in the next quarter, P/E coefficient , PEG ratio for 5 years, the dividend yield, the price/sales coefficient, the price/book value coefficient, previous closing price, the expected price at the end of the year.
The default companies:
- Google Inc (NASDAQ:GOOG)
- International Business Machines Corp. (IBM)
- Oracle Corporation (NASDAQ:ORCL)
- Cisco Systems, Inc. (CSCO)
- Microsoft Corporation (MSFT)
The application receives the information on the situation in stock exchange from Yahoo and Google companies.
If you have any questions and comments you can contact the developer of the application. We will certainly give you an answer!
Thank you for your choice!Aplikasi ini akan menginformasikan tentang pasar saham. Dengan antarmuka yang mudah, Anda akan selalu diberitahu tentang jatuhnya saat ini atau kenaikan saham di pasar. Anda dapat menambahkan jumlah yang tidak terbatas perusahaan dengan nama mereka. Anda juga dapat melihat grafik saham untuk perusahaan yang dipilih, dengan pilihan untuk memilih periode.
Fitur utama dari aplikasi:
• Grafik pertumbuhan dan jatuh oleh perusahaan yang dipilih.
• View harian, mingguan, bulanan, setengah tahunan, grafik tahunan, serta seluruh periode penjualan saham.
• Lihat semua data yang diperlukan pada saham (harga saat ini, persentase kenaikan atau penurunan, volume, terendah dan titik tertinggi, rata-rata, dan sebagainya).
• Mudah pengoperasian dan antarmuka user friendly aplikasi.
• Berbagai pengaturan antarmuka.
• Menambah perusahaan dengan simbol mereka di bursa saham.
• Off-line operasi untuk data terakhir download (tidak ada koneksi jaringan diperlukan).
• Cari tombol untuk pencarian perusahaan di bursa saham.
Data dasar:
Kisaran harga harian, kapitalisasi pasar, harga pembukaan, volume perdagangan, volume rata-rata selama 3 bulan, tanggal perdagangan terakhir, 50-day moving harga rata-rata, 200-day moving harga rata-rata, kisaran harga 52-minggu, Ask, Bid, EPS tahunan yang diharapkan, EPS diharapkan pada tahun depan, EPS diharapkan pada kuartal berikutnya, koefisien P / E rasio PEG selama 5 tahun, dividend yield, koefisien harga / penjualan, koefisien nilai harga / buku, harga penutupan sebelumnya, harga yang diharapkan pada akhir tahun ini.
Perusahaan-perusahaan default:
- Google Inc (NASDAQ: GOOG)
- International Business Machines Corp (IBM)
- Oracle Corporation (NASDAQ: ORCL)
- Cisco Systems, Inc (CSCO)
- Microsoft Corporation (MSFT)
Aplikasi ini menerima informasi tentang situasi di bursa saham dari Yahoo dan Google perusahaan.
Jika Anda memiliki pertanyaan dan komentar Anda dapat menghubungi pengembang aplikasi. Kami pasti akan memberikan jawaban!
Terima kasih untuk pilihan Anda!


